Case Studies and Examples
This section explains the methodology I use when developing systems, using a few examples of previous projects to highlight key points. .
Methodology
My approach has always been to use a top-down approach to system development, identifying each component, its interfaces, responsibilities and attributes. This worked well with traditional 'code-library' development, but has translated even better into Object Orientated techniques over the last 5 years. Currently
I only have 1 case study available, the others are works in progress...
Case Study 1 - Philippines Bureau of Local Government Support
1 - The problem
I was hired through the Asian Development Bank (ADB) to design a system for monitoring the performance of the Philippines Local Government Units (LGU), in cooperation with the Philippines Bureau of Local Government Support (BLGS) , and the Canadian International Development Assistance organisation (CIDA). The system was christened Local Government Performance measurement System (LGPMS), and was to capture, annually, the performance of each LGU around the country. The entering of data for an LGU is referred to in the rest of the case study as Data Capture.
LGU Structure
The LGU's in the Philippines are divided into 17 regions reporting to National HQ, each region containing 75 provinces, and each province coordinating data from approximately 20 Cities/Municipalities, leading to a total of 1500 LGU's.
Data flow
Data was to be captured at two of the LGU levels:
Provincial Government LGU, capturing information about the province.
City/Municipality LGU, capturing information about the city or Municipality.
and reported upwards to regional and national levels.
Data Sensitivity
Due to the political sensitivity of performance data, BLGS did not want actual data available to anyone outside the bureau, but they wanted people working for Provincial, Regional and National Government to be able to see the data for LGU that report to them.
Indicators
The system was required to capture information about a series of indicators, covering the Governance, Administration, Social Services, Economy and the Environment 'Performance Areas'. In addition each 'Performance Area' was broken down into a number of 'Result Areas', and these were further broken down into 'Service Areas'.
Indicators could be simple numeric inputs, a series of yes/no questions, a single answer from a multi-choice list, or a value calculated from two other indicators. An example indicator is shown below;
|
Performance Area |
Governance |
|||||||||
|
Service Area |
Financial Accountability |
|||||||||
|
Number |
1.1.1.1 |
|||||||||
|
Title |
Quality of Internal Control System |
|||||||||
|
Significance |
|
|||||||||
|
Score |
|
|
Rating |
Determine
the corresponding performance level of the LGU based on the
following rating scheme:
|
Indicator Rating
As can be seen from the above example, each indicator resolves to a rating between 1 and 5, no matter what the input format.
Reporting
The system was required to average the indicator ratings by Performance Area, Service Area, and Result Area, for a single LGU, as well as allowing people with the privileges to consolidate the data at provincial, regional and national levels.
2 - Constraints
Infrastructure. The nature of the country (thousands of islands) and the level of development mean that the major cities have a high level of infrastructure, but the provinces and smaller cities could be very remote, isolated and poorly connected.
Cost. The Philippines government does not have a great deal of money to spend on infrastructure or software.
Technical support. Any solution should require minimal ongoing support, due to the lack of skills within the government.
3 - Solution
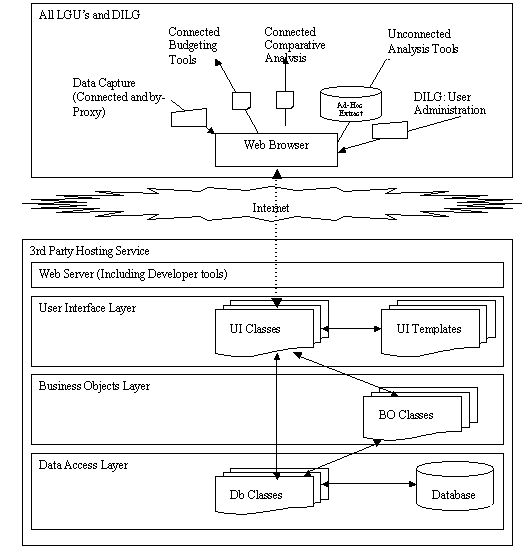
The final solution was to use a thin-client model , hosting the system over the public Internet, and using a 3rd party hosting service, as shown below. This had the advantages of outsourcing support problems, reducing capital investment, and increased physical security of the server.
Key points about the system are;
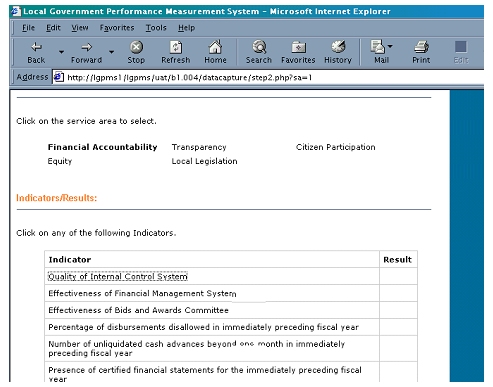
Simple Interface for most users. The users entering the data (data capture) might have limited I.T. skills, so the system must be extremely simple in most instances. This was achieved using a clean interface that mirrored the paper system, as the example Data Capture Indicator Selection, shows the user picking an indicator, and the Data Capture - List Indicator shows the user selecting from a multi-choice list. Complete novice users (i.e. those that had never used a computer before) were able to enter data after 1 hours training, and most had completed all 150 indicators, for their own LGU, within 4 hours.
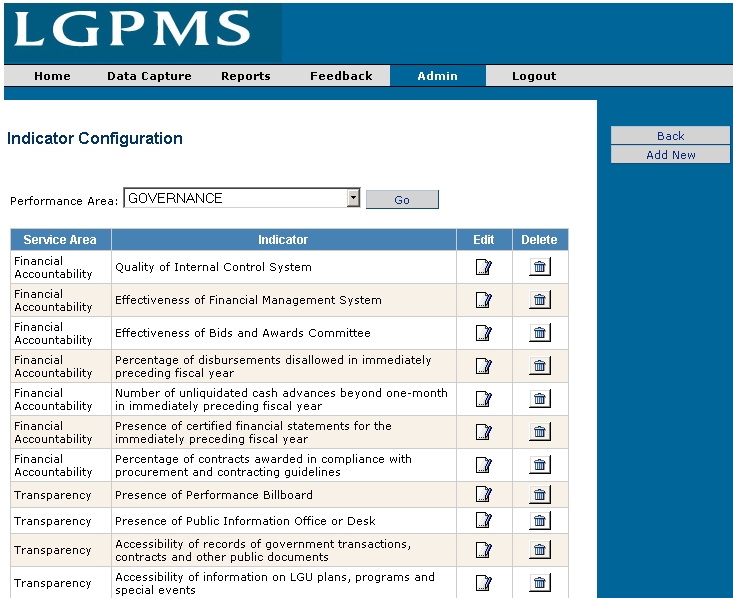
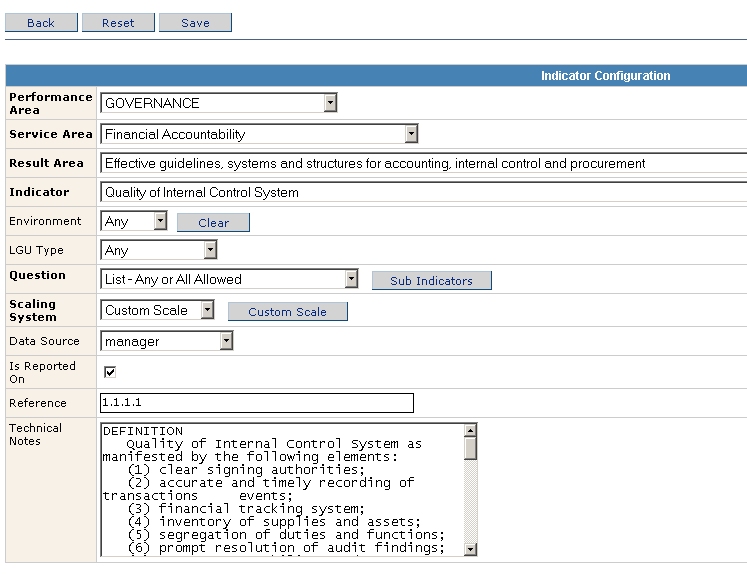
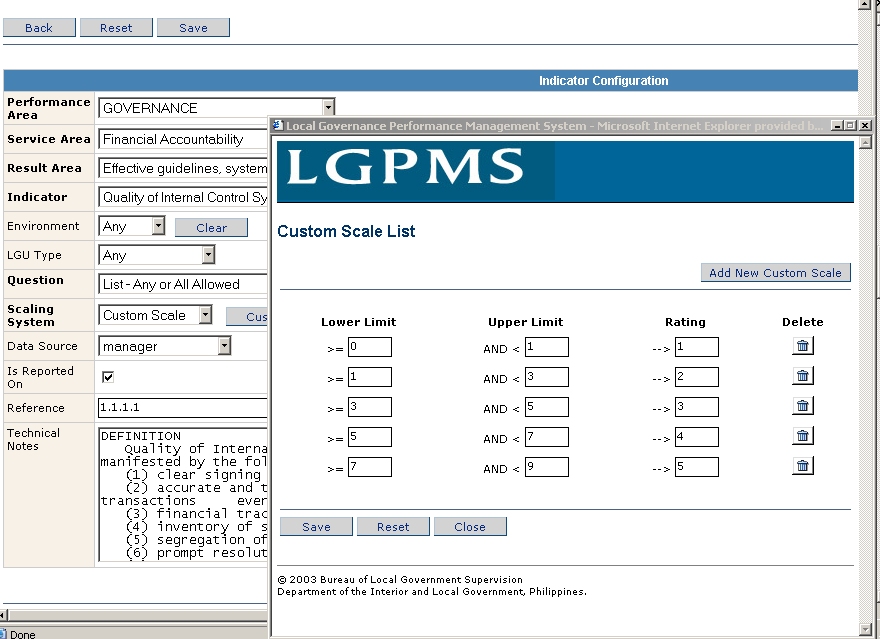
Configuration To allow BLGS to change their indicator and LGU configuration, yet still run reports over multiple years, a sophisticated configuration system was devised, to allow the administration users to change all settings for any year. The example shows how an administrator can configure where an indicator appears to the user, and the full details of the question. This question is configured to be a 'list', with its own or 'custom' scaling being used to convert the 8 choices offered to the user into a rating from 1-5. This highlights the most powerful part of the system, the ability to normalise all responses into a configurable scale, without the recourse to any more programming effort.
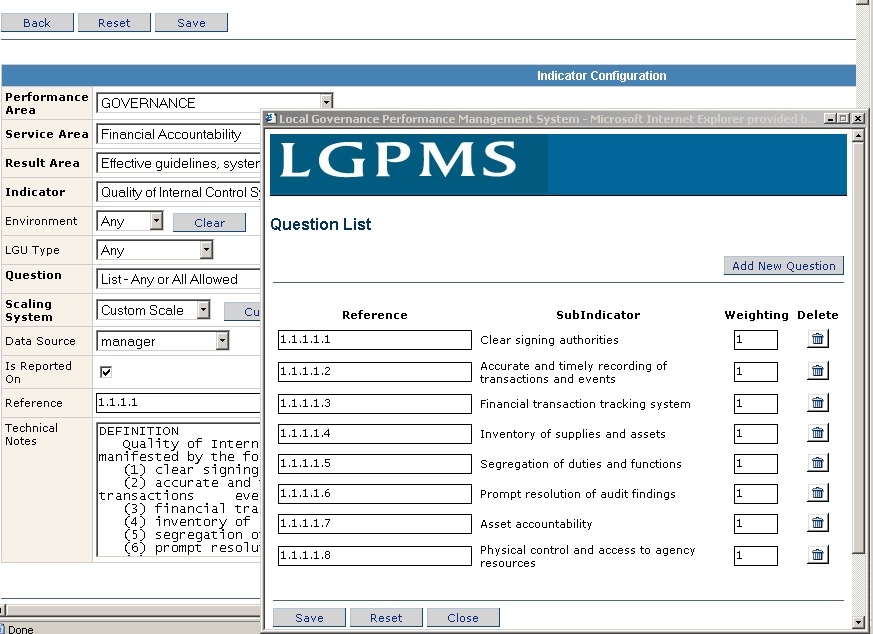
The following two screens show how an indicator is given a series of multi-choice questions, with each response given a weighting. the weightings are summed for the users selection, to get a result , which is then run through the scaling limits to give a rating. All of these options allow an administrator to control exactly how the system calculates LGU performance, without the user seeing any of the mechanics behind the scenes.
Reporting
The system contains a series of powerful reports, which are still being enhanced. the Component Report Walkthrough document describes how it is possible to drill down through the system to get detailed information, on the performance of a group of LGUs within a particular province.
4- Design
Development Modus Operandi:
The following organizations worked together to produce the system, each having the responsibilities outline below, and are collectively referred to as the (LGPMS) team.
BLGS: Business Analysis Team
Provide full functional specification
Perform UAT and agree sign off
Produce User Manuals and documentation
Perform User Training and Support
ADB – Dean Jones
Support BLGS in all of the above
Produce Detailed Technical Design of the system and database
Be responsible for completion of the system and achieving sign-off
Produce Technical user Manuals describing the functionality of the system.
Digital Solutions (Local Philippines Company)
Program the system to the design specifications
Provide long-term technical support
CIDA support
Provide project management and support
Provide technical assistance with the Indicators section of the Functional Specification
Software Architecture:
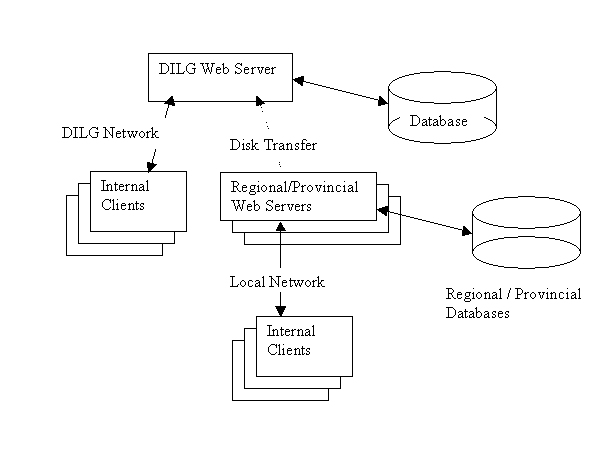
BLGS originally intended a complex replication system based around local servers distributed throughout the country, as shown below;
To negate the complexities around the replication infrastructure combined with the lack of technical I.T. skills within BLGS, then following solution was adopted.
The software environment chosen was as follows, based on cost considerations and the locally available experience.
Web Server: MS IIS on Windows or apache on Linux
Programming Language: PHP 4
Database: MySQL 4.01
Smarty: PHP template language, to allow separation of programming from U.I. design
Pear Database Objects: Database abstraction layer, provides simple database connectivity
Requirements Analysis: & Database Design:
The BLGS team were coached through the process of full requirements definition creating a series of functional specifications that were used to develop the database and object layers. I have highlighted one area as an example of database design methodology.
To allow for an increasing number of complex access level assignments, a user privileges were assigned on a user-by-user basis, and the concept of a 'resource' was defined in the database, to allow for new resources to be defined later on in the development cycle, without changing the database structure, as shown below.
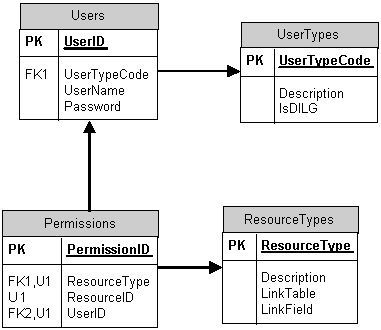
A user has a series of permissions on each resource type, with the permissions-->ResourceID field linking to the primary key in separate table, known as the 'resource'. The 'resource' table and field name are specified in the ResourceTypes table, thus allowing a new resource to be added.
If, in the future, BLGS were to require a new facility (such as assigning different access levels access to individual reports) the only database change would be a new record in 'ResourceTypes' - entered by the developer. The system would still have to have programming changes to support the new functionality, but no database schema changes would be required.
5 - Implementation Issues
The section contains examples of how the database deign, object design and implementation approach are coordinated together to improve the flexibility of the system.
LGU Structure
The approach I follow is to give greatest flexibility at the database layer, and
then reduce the flexibility whilst moving upwards through the Business layer
into the User Interface layer. This means that the database schema should be
able to cope with anything, and move changes will be confined to higher layers
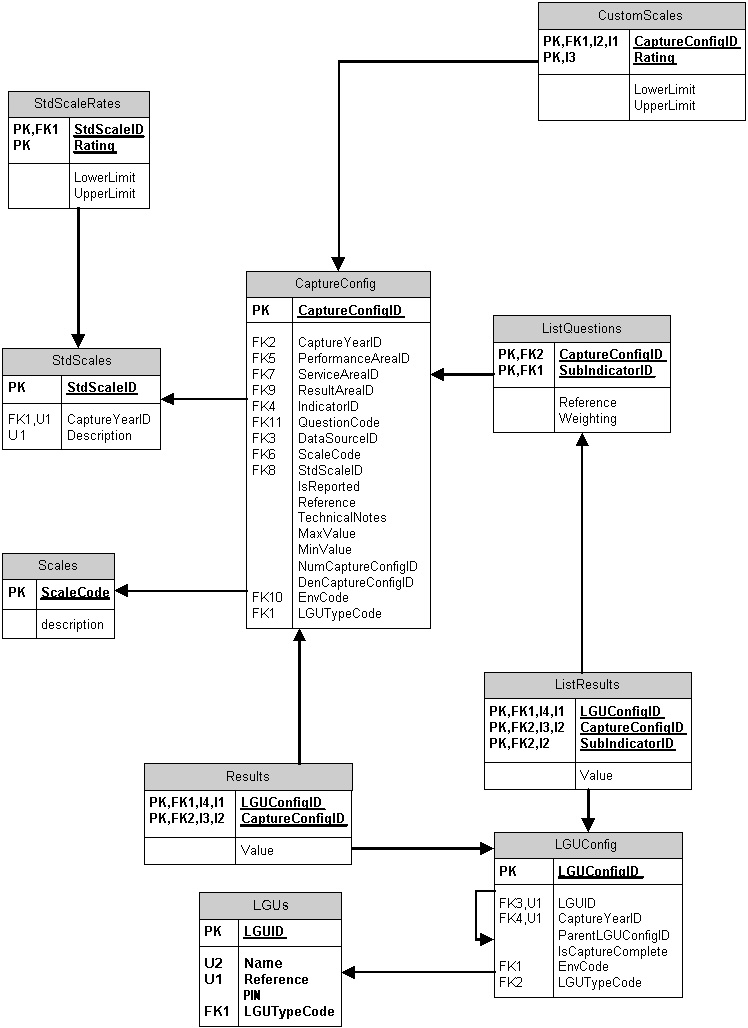
in the design model. As an example, the LGUs structure (what LGUs report to each
other) are all stored in one table, using a recursive one-many
relationship. (see Scaling Entity
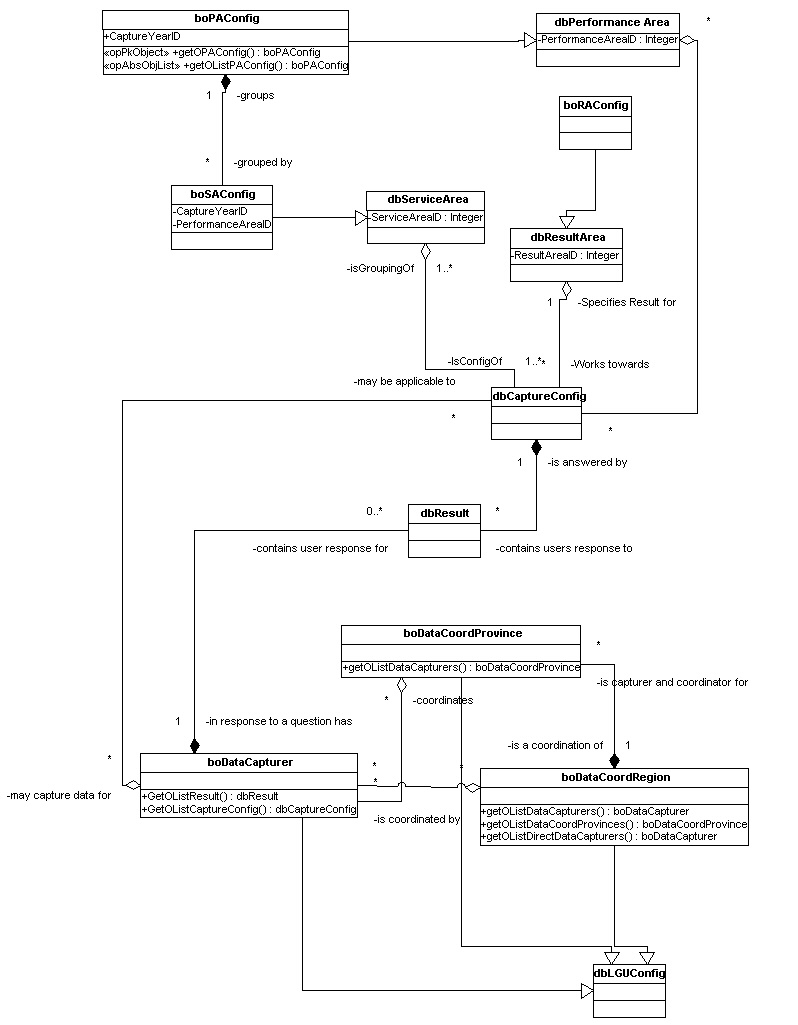
Model) At the next level up (Business Object layer), the LGU's are
differentiated into Data Capturers and Coordinators, as data is only
captured at the bottom of the LGU tree. The Coordinators are themselves divided
into Provinces and Regions, and further complicated by the fact that provinces
coordinate their own LGU's and also capture data themselves. This is all coped
with in the object layer, as shown in LGU
Structure Object Model.
Question Configuration
To cope with varying types of question and user-input, the system has been designed so that the measured indicators are 'soft'. This means that privileged users (administrators) can add, edit or delete questions, changing the entire makeup of the questions the users see, and configuring how the questions are configured. The question configuration can be changed for each year, allowing BLGS to phase out indicators that they no longer need to measure, add new indicators, and track indicators over a long term period, even if the question type or configuration such as Performance Areas change.
Rating
In addition to changing the question input and its position in the capture layout, each question is run through a scaling engine, that converts the users input into a value from 1-5. (The system is not to the ratings of 1-5 , and could easily be changed to return ratings of any other number)